Most businesses have more data than they know what to do with. It lives in Dynamics 365, in spreadsheets, in accounting systems, in operational tools that do not talk to each other. The result is that the people who need to make decisions are either waiting for a report that takes days to produce or making calls based on their instinct because the data is too hard to access. Microsoft Power BI and Azure are the tools that change that, and this article explains how they work together and what that looks like in practice.
What Microsoft Power BI Does
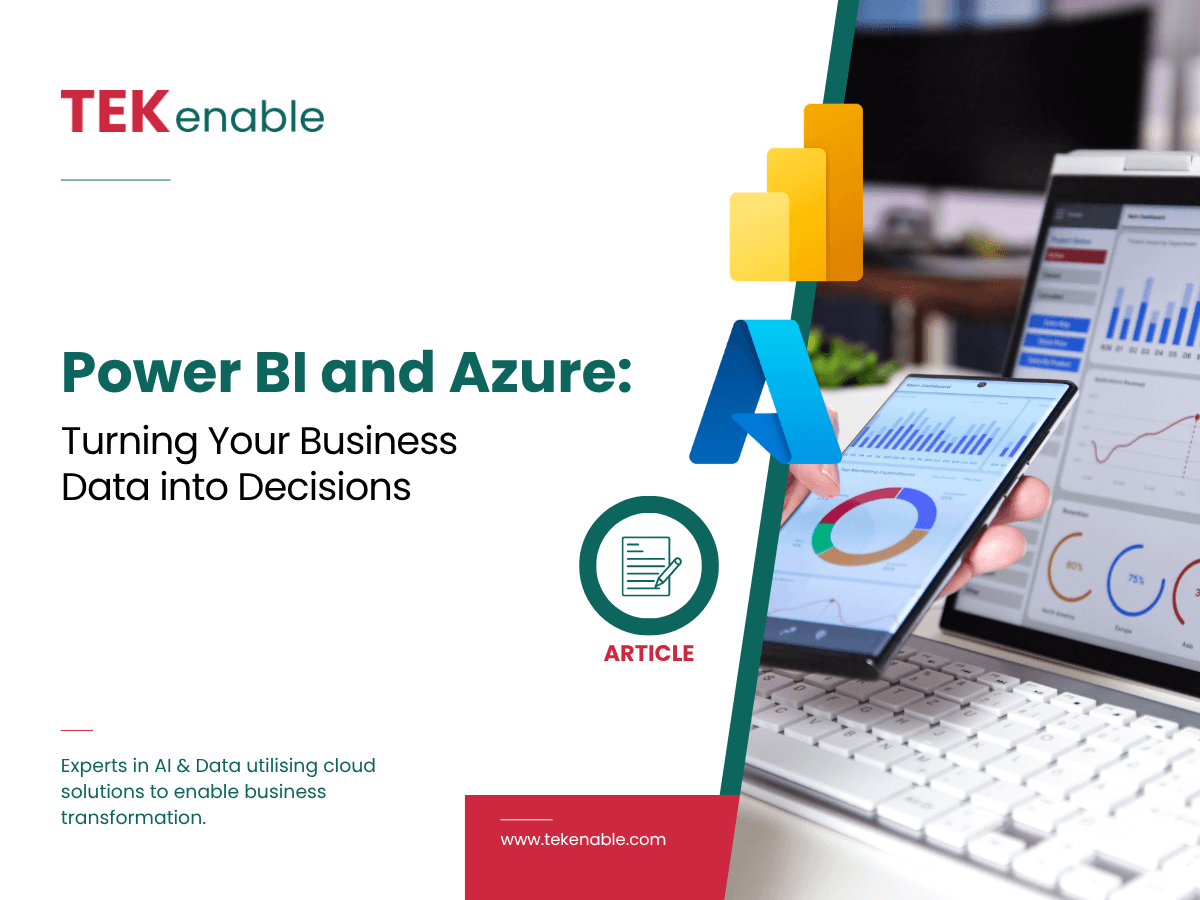
Power BI is a business intelligence platform that connects to data sources across your business, brings that data together, and presents it as interactive dashboards and reports that any business user can access from any device.
The most important word there is interactive. Unlike a PDF report or an Excel export, a Power BI dashboard lets you drill down, filter, and cross-reference in real time. A finance director can look at revenue by region, then click through to the underlying deals. A field service manager can see technician utilisation by week, then filter to a specific team or geography. The data stays live and the exploration happens in the tool, not in a follow-up email to the analyst.
Where Azure Comes In
Power BI is the front end: the dashboards and the reports. Azure is the infrastructure behind it that makes the data reliable, scalable, and secure.
Azure Data Factory
Moves and transforms data from multiple source systems into a central location. If your data lives in five different places, Data Factory brings it together without manual exports.
Azure Synapse Analytics
Processes large data sets that would be too slow or too large for a direct Power BI connection. Provides the analytical compute layer that sits between raw data and dashboards.
Azure OpenAI
Adds AI-powered analysis on top of your data: natural language querying, anomaly detection, forecasting, and pattern recognition across data sets at a scale and speed humans cannot match.
Azure data governance
Ensures data quality, security, and compliance across the analytics environment, including access controls, audit trails, and compliance with GDPR and other regulatory requirements.
The Dynamics 365 Connection
For businesses already using Dynamics 365, Power BI is the natural reporting layer. It connects natively to Business Central, Dynamics 365 Sales, Field Service, Customer Service, and Marketing, meaning you can build a single dashboard that combines CRM performance, field operations, financial data, and marketing results in one view without any manual data wrangling.
This is particularly valuable for leadership teams who currently get separate reports from different department heads and have to reconcile them manually. A well-built Power BI environment replaces that process with a single source of truth that updates in real time.
TEKenable runs an Azure Health Check as the first step for organisations looking to build a data and reporting capability. It maps your current data environment, identifies gaps and risks, and produces a prioritised roadmap for getting to the analytics outcomes you need. Learn about the Azure Health Check here.
TEKenable built a secure, Azure-based generative AI platform for a global enterprise, giving teams natural language access to unstructured knowledge with real-time analytics via Azure Log Analytics and optional Power BI visualisations layered on top. Read the case study on TEKenable’s Case Studies page.
Frequently Asked Questions
Want to Turn Your Data into Decisions?
TEKenable designs and builds Power BI and Azure data environments for Irish and UK businesses, connected to Dynamics 365 and your existing systems. We start with an Azure Health Check to map where you are and what the right path forward looks like.
Call +353 1 801 0800 · tekenable.com